Lacework Global Dashboard
The Global Dashboard displays a visual summary of the following items:
- All CloudTrail, network, user, and process events ingested by Lacework
- Entity behaviors identified by Lacework
- Events and critical events generated by Lacework
- You can filter on a timeframe using the Last … drop-down located in the upper right corner. You can filter from the last 24 hours to 90 days (or 180 days if you have subscribed for additional storage).
- Click Trends to switch the view to display Events over Time, a graph displaying events of varying severity (from critical to informational) over the same selected timeframe.

- Filter events by severity, under Events Over Time, select one or more checkboxes.
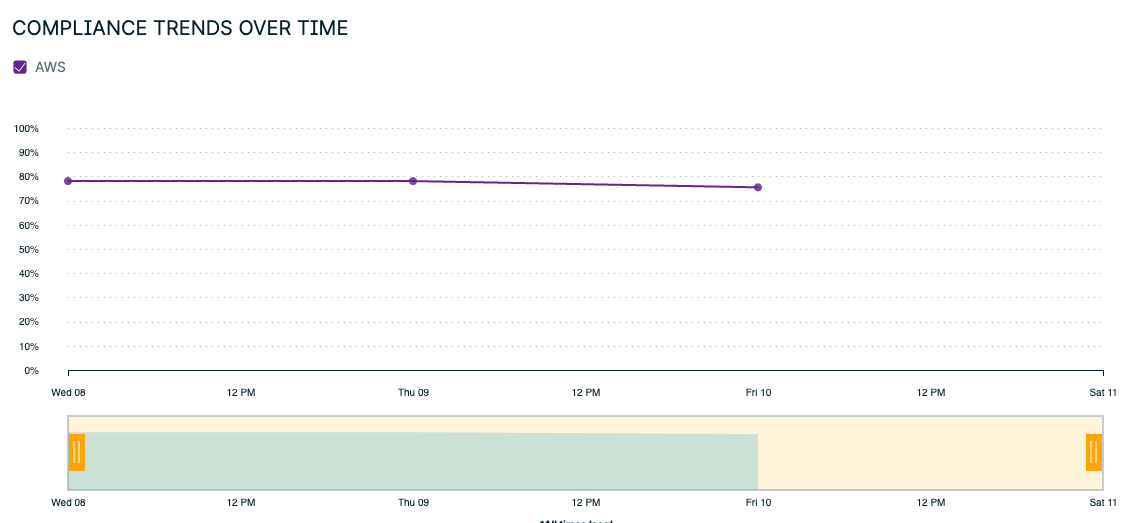
The slider bars underneath the graph allow you to zoom in to a smaller time period during the selected timeframe, for example, you can adjust both left and right sliders during a 3-day window to view a 4-hour window.
- Observe the Compliance Trends Over Time graph are two bar graphs that display CloudTrail and host events. The CloudTrail graph is populated with events only if a Lacework AWS integration is configured and the host graph is populated only if agents are deployed in your environment.
By default, the graph displays up to five event types. The listed order of the event types is weighted by the severity of the events followed by the total number of events, for example, one critical event is listed before two high severity events. If more than 5 event types are available for the selected time period, you can view the remaining event types by clicking the View … link below the graph.
- Observe the Cloud Compliance Events and Host Events panels to see the breakdown of events.

The Global Dashboard provides a quick view of your cloud security posture. It gives you a summary of your security data, trends and events.